
Wearable Medical Devices Market based on Product (Diagnostic Devices and Therapeutic Devices), Site (Handheld, Headband, Strap/Clip/Bracelet, Shoe Sensors, and Others), Application (Sports & Fitness, Remote Patient Monitoring, and Home Healthcare) and Geography – Global Forecast up to 2027
- July, 2021
- Domain: Healthcare - Medical Devices
- Get Free 10% Customization in this Report
Wearable medical devices are regularly observing devices that can remotely track a patient’s health condition. Wearable medical devices are available for monitoring various conditions, such as sleep monitoring devices, fetal monitoring devices, and many other devices. For example, sleep monitoring devices have to be worn all night to allow the device to record the oxygen consumption and the sleep lapse time. The same data is forwarded to the physician for analysis and treatment if required. The rising customer preference and awareness about fitness wearables will support the market growth, particularly among the youth. In addition, the increasing obese population, leading to higher adoption of physical activities, will increase the demand for wearable medical devices including Fitbit and smartwatches in the coming years. Other factors, including the increasing geriatric population and increasing spending capacities of consumers on health management technologies, are further anticipated to compel the market. On the other hand, threats such as data hacking and theft that hampers personal data security will be obstacles for wearable medical devices industry growth. The Wearable Medical Devices Market is likely to grow at the rate of 26.7% CAGR by 2027.
Research Methodology:
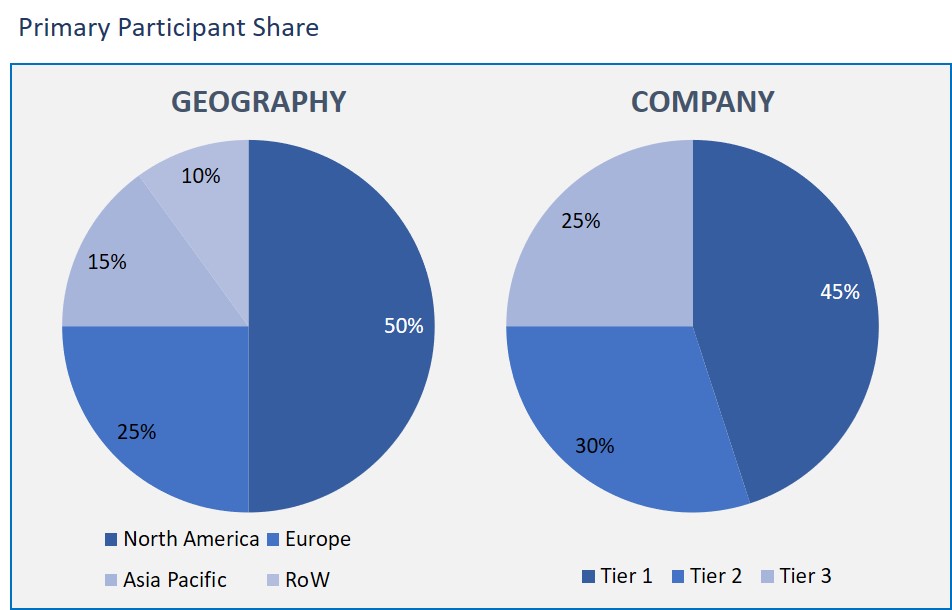
The Wearable medical devices market has been analyzed by utilizing the optimum combination of secondary sources and in-house methodology and a unique balance of primary insights. The real-time valuation of the market is an integral part of our forecasting and market sizing methodology. Industry experts and our primary participants have helped to compile related aspects with accurate parametric estimations for a complete study. The primary participants share is given below:
Wearable Medical Devices Market based on Product
- Diagnostic Devices
- Therapeutic Devices
Wearable Medical Devices Market based on Site
- Handheld
- Headband
- Strap/Clip/Bracelet
- Shoe Sensors
- Others
Wearable Medical Devices Market based on Application
- Sports & Fitness
- Remote Patient Monitoring
- Home Healthcare
Wearable Medical Devices Market based on Geography
- North America
- Europe
- Asia Pacific
- Rest of the World
Based on product, the diagnostic devices segment has the major share in the market. This is due to the rising prevalence of neurological disorders, which is the key factor impacting the segment's growth. In addition, rising awareness of the population about the capability of neurological wearables to evaluate the cognitive capabilities of individuals constantly during everyday activities is also projected to drive the segment.
As in the segmentation of site, the strap/clip/bracelet segment has held the dominant share in the wearable medical devices market. Products such as smartwatches facilitate monitoring of various parameters, including respiratory rate, mobility, pulse rate, and Bluetooth and cloud connectivity, which are projected to accelerate this segment's growth over the forecast period.
As per the application of wearable medical devices, the home healthcare segment has obtained a substantial share in the wearable medical devices market. The substantial share of the segment is attributed to the rising elderly population leveraging prevalence rates of target diseases. In addition, the increasing requirement to reduce healthcare expenditure as an economically feasible initiative is one of the few factors responsible for market growth.
North America has registered the highest market share in the wearable medical devices market based on geography. This is ascribed to the rising incidence of cardiovascular disorders, diabetes, and cancer in this region. In addition, the increase in chronic diseases which require regular monitoring and the presence of sophisticated healthcare infrastructure are further happening to drive market growth over the forecast period.
The wearable medical devices market size is likely to witness prominent growth in the coming years, considering the rising incidence of inactive lifestyles and the resultant increase in lifestyle disorders, such as hypertension and diabetes. These ailments commonly require constant tracking and monitoring physiological parameters such as blood pressure and blood sugar levels. This factor promotes the integration of healthcare data with medical devices, where the physicians can access real-time with minimum scope of errors.
The major vendors of the wearable medical devices market include Vital Connect Inc, Honeywell International Inc., Fitbit Inc. (Google LLC), Koninklijke Philips N.V., Apple Inc., Dexcom Inc., Garmin Ltd., Medtronic Plc, Abbott Laboratories, and Omron Corporation.
As a result, wearable medical devices play a prominent role in healthcare by yielding important patient data for better services by healthcare providers. For example, wearables compute data from daily activities, which can be used by physicians to improve diagnosis or treatment.
- This wearable medical devices market report depicts the geographical regions and sub-segment projected to have rapid growth and have a major share.
- This report provides the compelling factors and restricting the market growth and providing pitfalls and opportunities for the market.
- This report includes the information of the market-leading vendors and their position in the market.
- This report also consists of constant market developments and innovations taking place in the wearable medical devices market.
- Executive Summary
- Industry Outlook
- Industry Overview
- Industry Trends
- Market Snapshot
- Market Definition
- Market Outlook
- Porter Five Forces
- Related Markets
- Market characteristics
- Market Overview
- Market Segmentation
- Market Dynamics
- Drivers
- Restraints
- Opportunities
- DRO - Impact Analysis
- Product: Market Size & Analysis
- Overview
- Diagnostic Devices
- Therapeutic Devices
- Site: Market Size & Analysis
- Overview
- Handheld
- Headband
- Strap/Clip/Bracelet
- Shoe Sensors
- Others
- Application: Market Size & Analysis
- Overview
- Sports & Fitness
- Remote Patient Monitoring
- Home Healthcare
- Geography: Market Size & Analysis
- Overview
- North America
- Europe
- Asia Pacific
- Rest of the World
- Competitive Landscape
- Competitor Comparison Analysis
- Market Developments
- Mergers and Acquisitions, Legal, Awards, Partnerships
- Product Launches and execution
- Vendor Profiles
- Vital Connect Inc
- Overview
- Financial Overview
- Product Offerings
- Developments
- Business Strategy
- Honeywell International Inc.
- Overview
- Financial Overview
- Product Offerings
- Developments
- Business Strategy
- Fitbit Inc. (Google LLC)
- Overview
- Financial Overview
- Product Offerings
- Developments
- Business Strategy
- Koninklijke Philips N.V.
- Overview
- Financial Overview
- Product Offerings
- Developments
- Business Strategy
- Apple Inc.
- Overview
- Financial Overview
- Product Offerings
- Developments
- Business Strategy
- Dexcom Inc.
- Overview
- Financial Overview
- Product Offerings
- Developments
- Business Strategy
- Garmin Ltd.
- Overview
- Financial Overview
- Product Offerings
- Developments
- Business Strategy
- Medtronic Plc
- Overview
- Financial Overview
- Product Offerings
- Developments
- Business Strategy
- Abbott Laboratories
- Overview
- Financial Overview
- Product Offerings
- Developments
- Business Strategy
- Omron Corporation
- Overview
- Financial Overview
- Product Offerings
- Developments
- Business Strategy
- Vital Connect Inc
- Analyst Opinion
- Annexure
- Report Scope
- Market Definitions
- Research Methodology
- Data Collation and In-house Estimation
- Market Triangulation
- Forecasting
- Report Assumptions
- Declarations
- Stakeholders
- Abbreviations
TABLE 1. GLOBAL WEARABLE MEDICAL DEVICES MARKET VALUE, BY PRODUCT, 2021-2027 (USD BILLION)
TABLE 2. GLOBAL WEARABLE MEDICAL DEVICES MARKET VALUE FOR DIAGNOSTIC DEVICES, BY GEOGRAPHY, 2021-2027 (USD BILLION)
TABLE 3. GLOBAL WEARABLE MEDICAL DEVICES MARKET VALUE FOR THERAPEUTIC DEVICES, BY GEOGRAPHY, 2021-2027 (USD BILLION)
TABLE 4. GLOBAL WEARABLE MEDICAL DEVICES MARKET VALUE, BY SITE, BY GEOGRAPHY, 2021-2027 (USD BILLION)
TABLE 5. GLOBAL WEARABLE MEDICAL DEVICES MARKET VALUE FOR HANDHELD, BY GEOGRAPHY, 2021-2027 (USD BILLION)
TABLE 6. GLOBAL WEARABLE MEDICAL DEVICES MARKET VALUE FOR HEADBAND, BY GEOGRAPHY, 2021-2027 (USD BILLION)
TABLE 7. GLOBAL WEARABLE MEDICAL DEVICES MARKET VALUE FOR STRAP/CLIP/BRACELET, BY GEOGRAPHY, 2021-2027 (USD BILLION)
TABLE 8. GLOBAL WEARABLE MEDICAL DEVICES MARKET VALUE FOR SHOE SENSORS, BY GEOGRAPHY, 2021-2027 (USD BILLION)\
TABLE 9. GLOBAL WEARABLE MEDICAL DEVICES MARKET VALUE FOR OTHERS, BY GEOGRAPHY, 2021-2027 (USD BILLION)
TABLE 10. GLOBAL WEARABLE MEDICAL DEVICES MARKET VALUE, BY APPLICATION, 2021-2027 (USD BILLION)
TABLE 11. GLOBAL WEARABLE MEDICAL DEVICES MARKET VALUE FOR SPORTS & FITNESS, BY GEOGRAPHY, 2021-2027 (USD BILLION)
TABLE 12. GLOBAL WEARABLE MEDICAL DEVICES MARKET VALUE FOR REMOTE PATIENT MONITORING, BY GEOGRAPHY, 2021-2027 (USD BILLION)
TABLE 13. GLOBAL WEARABLE MEDICAL DEVICES MARKET VALUE FOR HOME HEALTHCARE, BY GEOGRAPHY, 2021-2027 (USD BILLION)
TABLE 14. NORTH AMERICA WEARABLE MEDICAL DEVICES MARKET VALUE, BY COUNTRY, 2021-2027 (USD BILLION)
TABLE 15. NORTH AMERICA WEARABLE MEDICAL DEVICES MARKET VALUE, BY PRODUCT, 2021-2027 (USD BILLION)
TABLE 16. NORTH AMERICA WEARABLE MEDICAL DEVICES MARKET VALUE, BY SITE, 2021-2027 (USD BILLION)
TABLE 17. NORTH AMERICA WEARABLE MEDICAL DEVICES MARKET VALUE, BY APPLICATION, 2021-2027 (USD BILLION)
TABLE 18. U.S WEARABLE MEDICAL DEVICES MARKET VALUE, BY PRODUCT, 2021-2027 (USD BILLION)
TABLE 19. U.S WEARABLE MEDICAL DEVICES MARKET VALUE, BY SITE, 2021-2027 (USD BILLION)
TABLE 20. U.S WEARABLE MEDICAL DEVICES MARKET VALUE, BY APPLICATION, 2021-2027 (USD BILLION)
TABLE 21. CANADA WEARABLE MEDICAL DEVICES MARKET VALUE, BY PRODUCT, 2021-2027 (USD BILLION)
TABLE 22. CANADA WEARABLE MEDICAL DEVICES MARKET VALUE, BY SITE, 2021-2027 (USD BILLION)
TABLE 23. CANADA WEARABLE MEDICAL DEVICES MARKET VALUE, BY APPLICATION, 2021-2027 (USD BILLION)
TABLE 24. EUROPE WEARABLE MEDICAL DEVICES MARKET VALUE, BY COUNTRY, 2021-2027 (USD BILLION)
TABLE 25. EUROPE WEARABLE MEDICAL DEVICES MARKET VALUE, BY PRODUCT, 2021-2027 (USD BILLION)
TABLE 26. EUROPE WEARABLE MEDICAL DEVICES MARKET VALUE, BY SITE, 2021-2027 (USD BILLION)
TABLE 27. EUROPE WEARABLE MEDICAL DEVICES MARKET VALUE, APPLICATION, 2021-2027 (USD BILLION)
TABLE 28. GERMANY WEARABLE MEDICAL DEVICES MARKET VALUE, BY PRODUCT, 2021-2027 (USD BILLION)
TABLE 29. GERMANY WEARABLE MEDICAL DEVICES MARKET VALUE, BY SITE, 2021-2027 (USD BILLION)
TABLE 30. GERMANY WEARABLE MEDICAL DEVICES MARKET VALUE, BY APPLICATION, 2021-2027 (USD BILLION)
TABLE 31. U.K WEARABLE MEDICAL DEVICES MARKET VALUE, BY PRODUCT, 2021-2027 (USD BILLION)
TABLE 32. U.K WEARABLE MEDICAL DEVICES MARKET VALUE, BY SITE, 2021-2027 (USD BILLION)
TABLE 33. U.K WEARABLE MEDICAL DEVICES MARKET VALUE, BY APPLICATION, 2021-2027 (USD BILLION)
TABLE 34. FRANCE WEARABLE MEDICAL DEVICES MARKET VALUE, BY PRODUCT, 2021-2027 (USD BILLION)
TABLE 35. FRANCE WEARABLE MEDICAL DEVICES MARKET VALUE, BY SITE, 2021-2027 (USD BILLION)
TABLE 36. FRANCE WEARABLE MEDICAL DEVICES MARKET VALUE, BY APPLICATION, 2021-2027 (USD BILLION)
TABLE 37. ITALY WEARABLE MEDICAL DEVICES MARKET VALUE, BY PRODUCT, 2021-2027 (USD BILLION)
TABLE 38. ITALY WEARABLE MEDICAL DEVICES MARKET VALUE, BY SITE, 2021-2027 (USD BILLION)
TABLE 39. ITALY WEARABLE MEDICAL DEVICES MARKET VALUE, BY APPLICATION, 2021-2027 (USD BILLION)
TABLE 40. SPAIN WEARABLE MEDICAL DEVICES MARKET VALUE, BY PRODUCT, 2021-2027 (USD BILLION)
TABLE 41. SPAIN WEARABLE MEDICAL DEVICES MARKET VALUE, BY SITE, 2021-2027 (USD BILLION)
TABLE 42. SPAIN WEARABLE MEDICAL DEVICES MARKET VALUE, BY APPLICATION, 2021-2027 (USD BILLION)
TABLE 43. ROE WEARABLE MEDICAL DEVICES MARKET VALUE, BY PRODUCT, 2021-2027 (USD BILLION)
TABLE 44. ROE WEARABLE MEDICAL DEVICES MARKET VALUE, BY SITE, 2021-2027 (USD BILLION)
TABLE 45. ROE WEARABLE MEDICAL DEVICES MARKET VALUE, BY APPLICATION, 2021-2027 (USD BILLION)
TABLE 46. ASIA PACIFIC WEARABLE MEDICAL DEVICES MARKET VALUE, BY COUNTRY, 2021-2027 (USD BILLION)
TABLE 47. ASIA PACIFIC WEARABLE MEDICAL DEVICES MARKET VALUE, BY PRODUCT, 2021-2027 (USD BILLION)
TABLE 48. ASIA PACIFIC WEARABLE MEDICAL DEVICES MARKET VALUE, BY SITE, 2021-2027 (USD BILLION)
TABLE 49. ASIA PACIFIC WEARABLE MEDICAL DEVICES MARKET VALUE, BY APPLICATION, 2021-2027 (USD BILLION)
TABLE 50. CHINA WEARABLE MEDICAL DEVICES MARKET VALUE, BY PRODUCT, 2021-2027 (USD BILLION)
TABLE 51. CHINA WEARABLE MEDICAL DEVICES MARKET VALUE, BY SITE, 2021-2027 (USD BILLION)
TABLE 52. CHINA WEARABLE MEDICAL DEVICES MARKET VALUE, BY APPLICATION, 2021-2027 (USD BILLION)
TABLE 53. INDIA WEARABLE MEDICAL DEVICES MARKET VALUE, BY PRODUCT, 2021-2027 (USD BILLION)
TABLE 54. INDIA WEARABLE MEDICAL DEVICES MARKET VALUE, BY SITE, 2021-2027 (USD BILLION)
TABLE 55. INDIA WEARABLE MEDICAL DEVICES MARKET VALUE, BY APPLICATION, 2021-2027 (USD BILLION)
TABLE 56. JAPAN WEARABLE MEDICAL DEVICES MARKET VALUE, BY PRODUCT, 2021-2027 (USD BILLION)
TABLE 57. JAPAN WEARABLE MEDICAL DEVICES MARKET VALUE, BY SITE, 2021-2027 (USD BILLION)
TABLE 58. JAPAN WEARABLE MEDICAL DEVICES MARKET VALUE, BY APPLICATION, 2021-2027 (USD BILLION)
TABLE 59. REST OF APAC WEARABLE MEDICAL DEVICES MARKET VALUE, BY PRODUCT, 2021-2027 (USD BILLION)
TABLE 60. REST OF APAC WEARABLE MEDICAL DEVICES MARKET VALUE, BY SITE, 2021-2027 (USD BILLION)
TABLE 61. REST OF APAC WEARABLE MEDICAL DEVICES MARKET VALUE, BY APPLICATION, 2021-2027 (USD BILLION)
TABLE 62. REST OF WORLD WEARABLE MEDICAL DEVICES MARKET VALUE, BY PRODUCT, 2021-2027 (USD BILLION)
TABLE 63. REST OF WORLD WEARABLE MEDICAL DEVICES MARKET VALUE, BY SITE, 2021-2027 (USD BILLION)
TABLE 64. REST OF WORLD WEARABLE MEDICAL DEVICES MARKET VALUE, BY APPLICATION, 2021-2027 (USD BILLION)
TABLE 65. VITAL CONNECT INC: FINANCIALS
TABLE 66. VITAL CONNECT INC: PRODUCTS & SERVICES
TABLE 67. VITAL CONNECT INC: RECENT DEVELOPMENTS
TABLE 68. HONEYWELL INTERNATIONAL INC: FINANCIALS
TABLE 69. HONEYWELL INTERNATIONAL INC: PRODUCTS & SERVICES
TABLE 70. HONEYWELL INTERNATIONAL INC: RECENT DEVELOPMENTS
TABLE 71. FITBIT INC. (GOOGLE LLC): FINANCIALS
TABLE 72. FITBIT INC. (GOOGLE LLC): PRODUCTS & SERVICES
TABLE 73. FITBIT INC. (GOOGLE LLC): RECENT DEVELOPMENTS
TABLE 74. KONINKLIJKE PHILIPS N.V.: FINANCIALS
TABLE 75. KONINKLIJKE PHILIPS N.V.: PRODUCTS & SERVICES
TABLE 76. KONINKLIJKE PHILIPS N.V.: RECENT DEVELOPMENTS
TABLE 77. APPLE INC: FINANCIALS
TABLE 78. APPLE INC: PRODUCTS & SERVICES
TABLE 79. APPLE INC: RECENT DEVELOPMENTS
TABLE 80. DEXCOM INC: FINANCIALS
TABLE 81. DEXCOM INC: PRODUCTS & SERVICES
TABLE 82. DEXCOM INC: RECENT DEVELOPMENTS
TABLE 83. GARMIN LTD: FINANCIALS
TABLE 84. GARMIN LTD: PRODUCTS & SERVICES
TABLE 85. GARMIN LTD: RECENT DEVELOPMENTS
TABLE 86. MEDTRONIC PLC: FINANCIALS
TABLE 87. MEDTRONIC PLC: PRODUCTS & SERVICES
TABLE 88. MEDTRONIC PLC: RECENT DEVELOPMENTS
TABLE 89. ABBOTT LABORATORIES: FINANCIALS
TABLE 90. ABBOTT LABORATORIES: PRODUCTS & SERVICES
TABLE 91. ABBOTT LABORATORIES: RECENT DEVELOPMENTS
TABLE 92. OMRON CORPORATION: FINANCIALS
TABLE 93. OMRON CORPORATION: PRODUCTS & SERVICES
TABLE 94. OMRON CORPORATION: RECENT DEVELOPMENTS
Research Framework
Infoholic Research works on a holistic 360° approach in order to deliver high quality, validated and reliable information in our market reports. The Market estimation and forecasting involves following steps:
- Data Collation (Primary & Secondary)
- In-house Estimation (Based on proprietary data bases and Models)
- Market Triangulation
- Forecasting

Market related information is congregated from both primary and secondary sources.
Primary sources
Involved participants from all global stakeholders such as Solution providers, service providers, Industry associations, thought leaders etc. across levels such as CXOs, VPs and managers. Plus, our in-house industry experts having decades of industry experience contribute their consulting and advisory services.
Secondary sources
Include public sources such as regulatory frameworks, government IT spending, government demographic indicators, industry association statistics, and company publications along with paid sources such as Factiva, OneSource, Bloomberg among others.
![]()


