
Spirometer Market based on Type (Hand Held, Table Top, and Desktop), Mechanism (Volume Measurement and Peak Flow Meters), Application (COPD, Asthma, and Other Applications), End-User, and Geography ¬– Global Forecast up to 2026
- April, 2021
- Domain: Healthcare - Medical Devices
- Get Free 10% Customization in this Report
Growth in the frequency of chronic respiratory diseases, increasing preference for home healthcare, and technological advancements are anticipated to drive the Spirometer market. Spirometry usage for asthma diagnosis is not frequent in pediatric patients, especially in resource-poor countries where non-communicable diseases are higher. The strategies to raise the spirometry assessment frequency can decrease the burden of non-communicable diseases. Modern spirometry devices standardize test results and provide quick responses, unlike conventional devices. The need for condensed hospital stays has been growing due to the popularity of ambulatory care settings. The Spirometer Market is projected to grow at the rate of 11.7% CAGR by 2026.
Research Methodology:
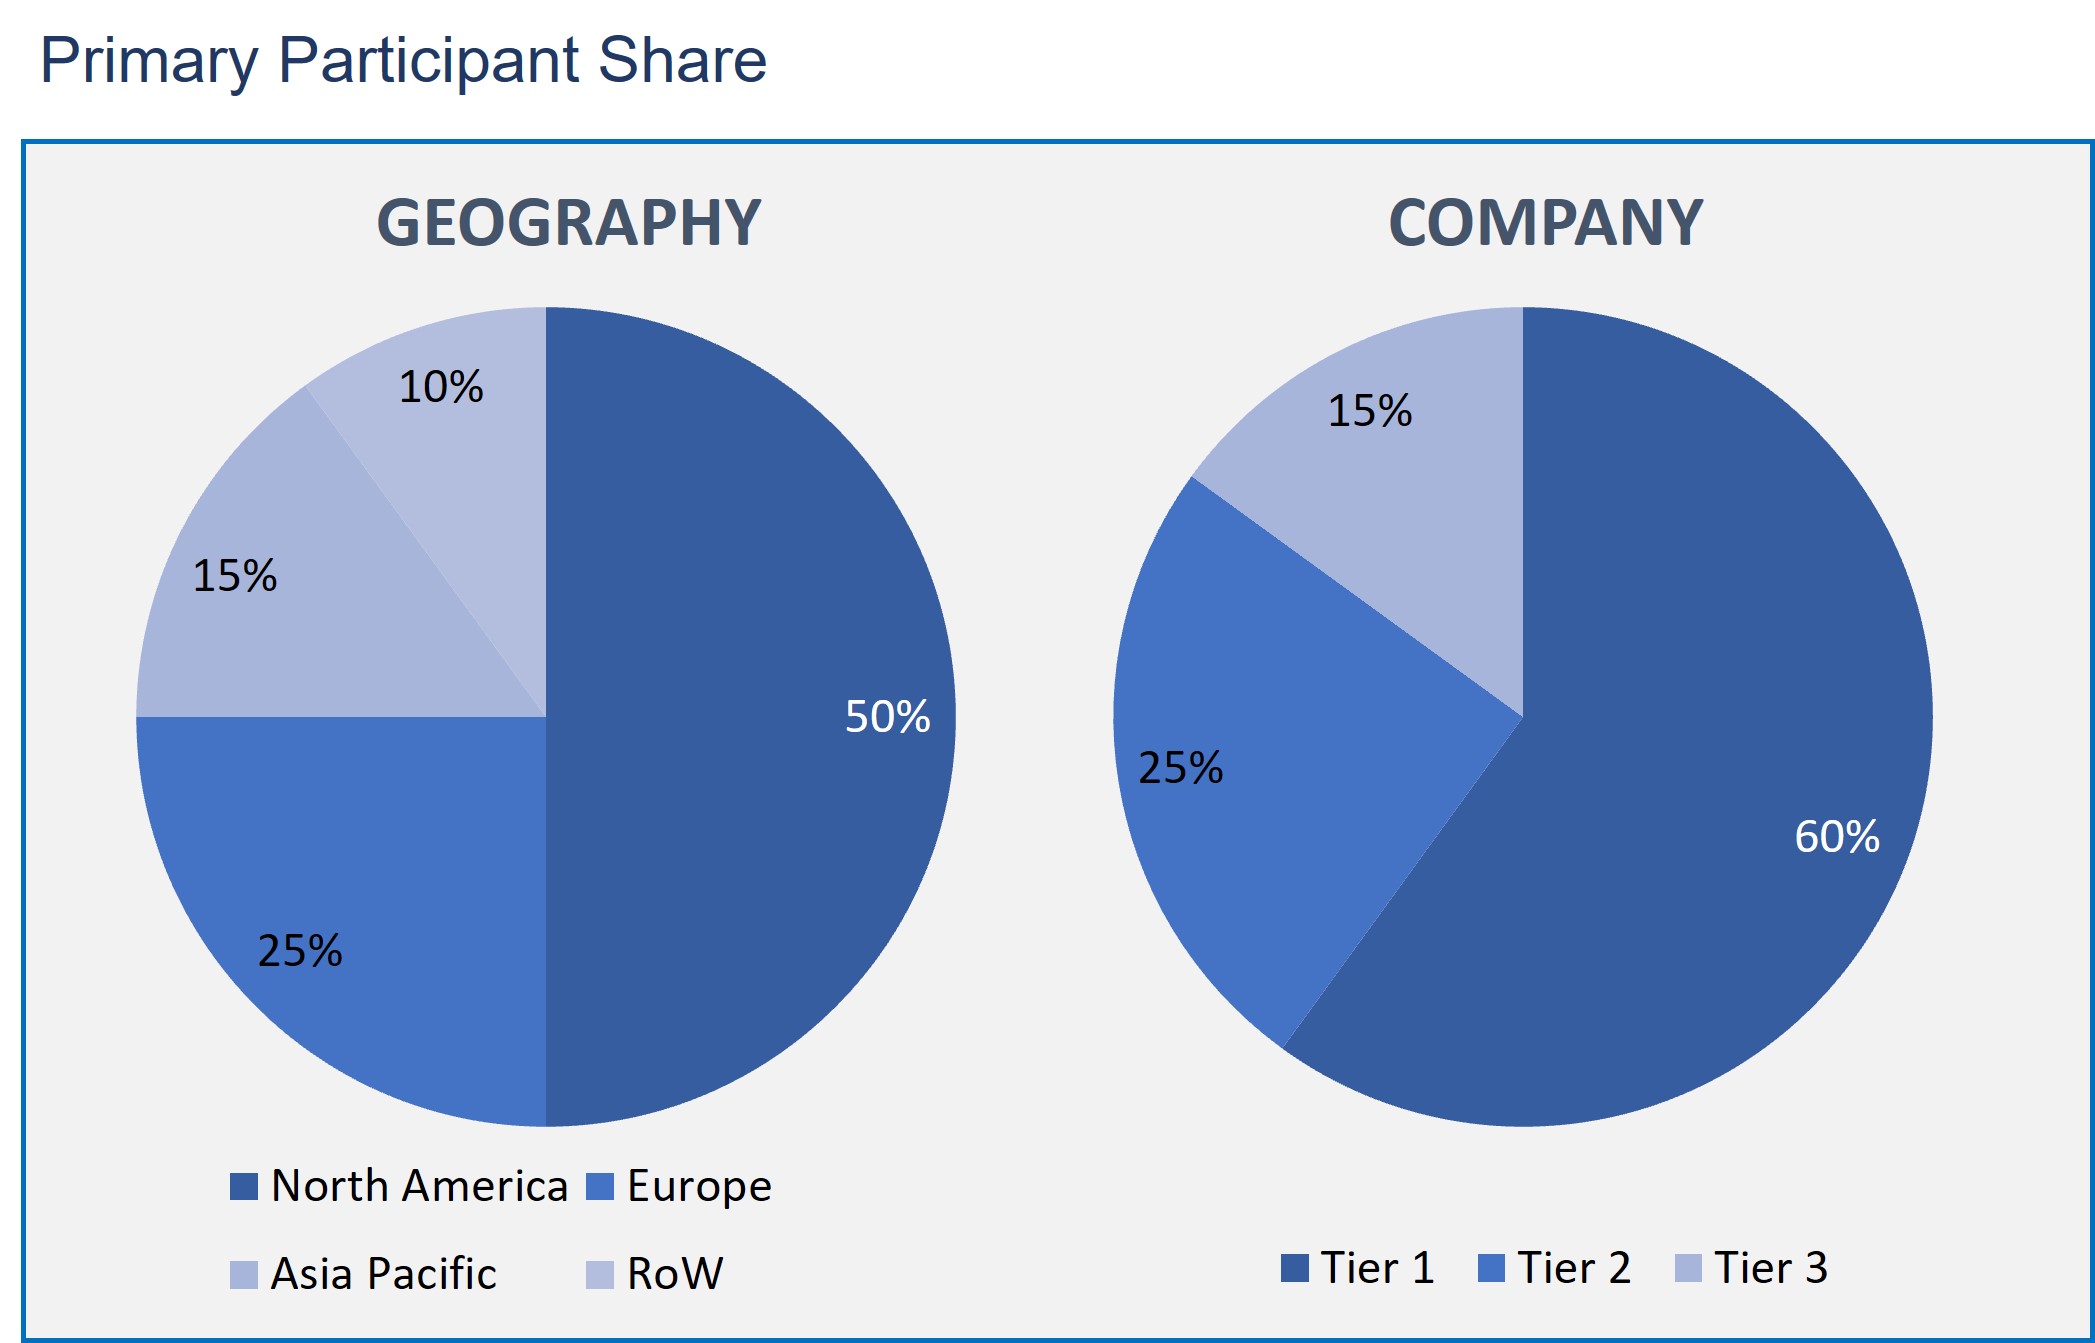
The Spirometer market has been analyzed by utilizing the optimum combination of secondary sources and in-house methodology and a unique balance of primary insights. The real-time valuation of the market is an integral part of our forecasting and market sizing methodology. Industry experts and our primary participants have helped to compile related aspects with accurate parametric estimations for a complete study. The primary participants share is given below:
Spirometer Market based on Type
- Hand-Held
- Table Top
- Desktop
Spirometer Market based on Mechanism
- Volume Measurement
- Peak Flow Meters
Spirometer Market based on Application
- Chronic Obstructive Pulmonary Disease (COPD)
- Asthma
- Other Applications
Spirometer Market based on End-user
- Hospitals
- Clinical Laboratories
- Homecare Settings
- Industrial Settings
Spirometer Market based on Geography
- North America
- Europe
- Asia Pacific
- Rest of the World
The market in terms of application, is segregated into asthma, COPD, and others. COPD segment is estimated to be the highest segment in 2019. This segment's major share can be attributed to the high and increasing frequency of COPD worldwide and the easy COPD diagnosis offered by spirometry.
In terms of End Users, the spirometer market is segmented into hospitals, clinical laboratories, home care settings, and industrial settings. The hospital segment is projected to account for the highest share in 2019. The rapidly rising aging population, the launch of advanced spirometer devices, and the increasing reimbursements for clinical tests performed in hospitals are the factors driving this market's development during the estimated period.
The spirometer market by mechanism is segmented into flow-sensing spirometer and peak flow meters. The flow-sensing segment accounted for the larger market share in 2019 and is expected to witness a higher development rate.
The North American market is likely to register a significant market share in 2019. This is majorly due to the increasing incidence of chronic respiratory diseases and technological advancements in the region.
Performing a spirometry test includes blowing into the mouthpiece at total lung capacity for six seconds. To ensure test results' accuracy, a patient must complete the test in triplicates, followed by a repeatability test which makes the test time-consuming and strenuous; it may also touch patient compliance for follow-up tests.
This report profiles of companies that are leading the Spirometer market include: Hill-Rom, Inc, Midmark Corp, Futuremed, COSMED, MGC Diagnostics Corporation, Vyaire Medical, Medical International Research, Vitalograph, ndd Medical Technologies Inc., Schiller AG, Jones Medical Instrument Company, Sibelmed, MIR, Recorders and Medicare Systems, Smiths Medical, Medline, Teleflex, CONTEC, Fysiomed, Medikro, Sdi Diagnostics, CHEST M.I Inc, FUKUDA SANGYO Co. Ltd, Clarity Medical, and Guangzhou Medsinglong Medical Equipment Co., Ltd.
- This report offers an overall analysis of the Spirometer market growth drivers, restraints, opportunities, and other related challenges.
- This report depicts the market developments such as new product launches, mergers and acquisitions, diversification, and joint ventures of the market players.
- This report also describes all potential segments and sub-segments present in the market to help the companies in strategic business planning.
- This report also gives the regional analysis of the Mice Model market in terms of market penetration across the world.
- Executive Summary
- Industry Outlook
- Industry Overview
- Industry Trends
- Market Snapshot
- Market Definition
- Market Outlook
- Porter Five Forces
- Related Markets
- Market characteristics
- Market Overview
- Market Segmentation
- Market Dynamics
- Drivers
- Restraints
- Opportunities
- DRO - Impact Analysis
- Type: Market Size & Analysis
- Overview
- Hand Held
- Table Top
- Desktop
- Mechanism: Market Size & Analysis
- Overview
- Volume Measurement
- Peak Flow Meters
- Application: Market Size & Analysis
- Overview
- Chronic Obstructive Pulmonary Disease (COPD)
- Asthma
- Other Applications
- End User: Market Size & Analysis
- Overview
- Hospitals
- Clinical Laboratories
- Homecare Settings
- Industrial Settings
- Geography: Market Size & Analysis
- Overview
- North America
- Europe
- Asia Pacific
- Rest of the World
- Competitive Landscape
- Competitor Comparison Analysis
- Market Developments
- Mergers and Acquisitions, Legal, Awards, Partnerships
- Product Launches and execution
- Vendor Profiles
- MIR, Recorders and Medicare Systems
- Overview
- Financial Overview
- Product Offerings
- Developments
- Business Strategy
- MGC Diagnostics Corporation
- Overview
- Financial Overview
- Product Offerings
- Developments
- Business Strategy
- Jones Medical Instrument Company
- Overview
- Financial Overview
- Product Offerings
- Developments
- Business Strategy
- Hill-Rom, Inc.
- Overview
- Financial Overview
- Product Offerings
- Developments
- Business Strategy
- Midmark Corp.
- Overview
- Financial Overview
- Product Offerings
- Developments
- Business Strategy
- Futuremed
- Overview
- Financial Overview
- Product Offerings
- Developments
- Business Strategy
- COSMED
- Overview
- Financial Overview
- Product Offerings
- Developments
- Business Strategy
- Medical International Research
- Overview
- Financial Overview
- Product Offerings
- Developments
- Business Strategy
- Vyaire Medical
- Overview
- Financial Overview
- Product Offerings
- Developments
- Business Strategy
- Vitalograph
- Overview
- Financial Overview
- Product Offerings
- Developments
- Business Strategy
- MIR, Recorders and Medicare Systems
- Companies to Watch
- ndd Medical Technologies, Inc.
- Overview
- Products & Services
- Business Strategy
- Schiller AG
- Overview
- Products & Services
- Business Strategy
- ndd Medical Technologies, Inc.
- Analyst Opinion
- Annexure
- Report Scope
- Market Definitions
- Research Methodology
- Data Collation and In-house Estimation
- Market Triangulation
- Forecasting
- Report Assumptions
- Declarations
- Stakeholders
- Abbreviations
TABLE 1. GLOBAL SPIROMETER MARKET VALUE, BY TYPE, 2020-2026 (USD BILLION)
TABLE 2. GLOBAL SPIROMETER MARKET VALUE FOR HAND HELD, BY GEOGRAPHY, 2020-2026 (USD BILLION)
TABLE 3. GLOBAL SPIROMETER MARKET VALUE FOR TABLE TOP, BY GEOGRAPHY, 2020-2026 (USD BILLION)
TABLE 4. GLOBAL SPIROMETER MARKET VALUE FOR DESKTOP, BY GEOGRAPHY, 2020-2026 (USD BILLION)
TABLE 5. GLOBAL SPIROMETER MARKET VALUE, BY MECHANISM, 2020-2026 (USD BILLION)
TABLE 6. GLOBAL SPIROMETER MARKET VALUE FOR VOLUME MEASUREMENT, BY GEOGRAPHY, 2020-2026 (USD BILLION)
TABLE 7. GLOBAL SPIROMETER MARKET VALUE FOR PEAK FLOW METERS, BY GEOGRAPHY, 2020-2026 (USD BILLION)
TABLE 8. GLOBAL SPIROMETER MARKET VALUE, BY APPLICATION, 2020-2026 (USD BILLION)
TABLE 9. GLOBAL SPIROMETER MARKET VALUE FOR CHRONIC OBSTRUCTIVE PULMONARY DISEASE (COPD), BY GEOGRAPHY, 2020-2026 (USD BILLION)
TABLE 10. GLOBAL SPIROMETER MARKET VALUE FOR ASTHMA, BY GEOGRAPHY, 2020-2026 (USD BILLION)
TABLE 11. GLOBAL SPIROMETER MARKET VALUE FOR OTHER APPLICATIONS, BY GEOGRAPHY, 2020-2026 (USD BILLION)
TABLE 12. GLOBAL SPIROMETER MARKET VALUE, END USER, 2020-2026 (USD BILLION)
TABLE 13. GLOBAL SPIROMETER MARKET VALUE FOR HOSPITALS, BY GEOGRAPHY, 2020-2026 (USD BILLION)
TABLE 14. GLOBAL SPIROMETER MARKET VALUE FOR CLINICAL LABORATORIES, BY GEOGRAPHY, 2020-2026 (USD BILLION)
TABLE 15. GLOBAL SPIROMETER MARKET VALUE FOR HOMECARE SETTINGS, BY GEOGRAPHY, 2020-2026 (USD BILLION)
TABLE 16. GLOBAL SPIROMETER MARKET VALUE FOR INDUSTRIAL SETTINGS, BY GEOGRAPHY, 2020-2026 (USD BILLION)
TABLE 17. NORTH AMERICA SPIROMETER MARKET VALUE, BY COUNTRY, 2020-2026 (USD BILLION)
TABLE 18. NORTH AMERICA SPIROMETER MARKET VALUE, BY TYPE, 2020-2026 (USD BILLION)
TABLE 19. NORTH AMERICA SPIROMETER MARKET VALUE, BY MECHANISM, 2020-2026 (USD BILLION)
TABLE 20. NORTH AMERICA SPIROMETER MARKET VALUE, BY APPLICATION, 2020-2026 (USD BILLION)
TABLE 21. NORTH AMERICA SPIROMETER MARKET VALUE, BY END USER, 2020-2026 (USD BILLION)
TABLE 22. U.S SPIROMETER MARKET VALUE, BY TYPE, 2020-2026 (USD BILLION)
TABLE 23. U.S SPIROMETER MARKET VALUE, BY MECHANISM, 2020-2026 (USD BILLION)
TABLE 24. U.S SPIROMETER MARKET VALUE, BY APPLICATION, 2020-2026 (USD BILLION)
TABLE 25. U.S SPIROMETER MARKET VALUE, BY END USER, 2020-2026 (USD BILLION)
TABLE 26. CANADA SPIROMETER MARKET VALUE, BY TYPE, 2020-2026 (USD BILLION)
TABLE 27. CANADA SPIROMETER MARKET VALUE, BY MECHANISM, 2020-2026 (USD BILLION)
TABLE 28. CANADA SPIROMETER MARKET VALUE, BY APPLICATION, 2020-2026 (USD BILLION)
TABLE 29. CANADA SPIROMETER MARKET VALUE, BY END USER, 2020-2026 (USD BILLION)
TABLE 30. EUROPE SPIROMETER MARKET VALUE, BY COUNTRY, 2020-2026 (USD BILLION)
TABLE 31. EUROPE SPIROMETER MARKET VALUE, BY TYPE, 2020-2026 (USD BILLION)
TABLE 32. EUROPE SPIROMETER MARKET VALUE, BY MECHANISM, 2020-2026 (USD BILLION)
TABLE 33. EUROPE SPIROMETER MARKET VALUE, BY APPLICATION, 2020-2026 (USD BILLION)
TABLE 34. EUROPE SPIROMETER MARKET VALUE, BY END USER, 2020-2026 (USD BILLION)
TABLE 35. GERMANY SPIROMETER MARKET VALUE, BY TYPE, 2020-2026 (USD BILLION)
TABLE 36. GERMANY SPIROMETER MARKET VALUE, BY MECHANISM, 2020-2026 (USD BILLION)
TABLE 37. GERMANY SPIROMETER MARKET VALUE, BY APPLICATION, 2020-2026 (USD BILLION)
TABLE 38. GERMANY SPIROMETER MARKET VALUE, BY END USER, 2020-2026 (USD BILLION)
TABLE 39. U.K SPIROMETER MARKET VALUE, BY TYPE, 2020-2026 (USD BILLION)
TABLE 40. U.K SPIROMETER MARKET VALUE, BY MECHANISM, 2020-2026 (USD BILLION)
TABLE 41. U.K SPIROMETER MARKET VALUE, BY APPLICATION, 2020-2026 (USD BILLION)
TABLE 42. U.K SPIROMETER MARKET VALUE, BY END USER, 2020-2026 (USD BILLION)
TABLE 43. FRANCE SPIROMETER MARKET VALUE, BY TYPE, 2020-2026 (USD BILLION)
TABLE 44. FRANCE SPIROMETER MARKET VALUE, BY MECHANISM, 2020-2026 (USD BILLION)
TABLE 45. FRANCE SPIROMETER MARKET VALUE, BY APPLICATION, 2020-2026 (USD BILLION)
TABLE 46. FRANCE SPIROMETER MARKET VALUE, BY END USER, 2020-2026 (USD BILLION)
TABLE 47. ITALY SPIROMETER MARKET VALUE, BY TYPE, 2020-2026 (USD BILLION)
TABLE 48. ITALY SPIROMETER MARKET VALUE, BY MECHANISM, 2020-2026 (USD BILLION)
TABLE 49. ITALY SPIROMETER MARKET VALUE, BY APPLICATION, 2020-2026 (USD BILLION)
TABLE 50. ITALY SPIROMETER MARKET VALUE, BY END USER, 2020-2026 (USD BILLION)
TABLE 51. SPAIN SPIROMETER MARKET VALUE, BY TYPE, 2020-2026 (USD BILLION)
TABLE 52. SPAIN SPIROMETER MARKET VALUE, BY MECHANISM, 2020-2026 (USD BILLION)
TABLE 53. SPAIN SPIROMETER MARKET VALUE, BY APPLICATION, 2020-2026 (USD BILLION)
TABLE 54. SPAIN SPIROMETER MARKET VALUE, BY END USER, 2020-2026 (USD BILLION)
TABLE 55. ROE SPIROMETER MARKET VALUE, BY TYPE, 2020-2026 (USD BILLION)
TABLE 56. ROE SPIROMETER MARKET VALUE, BY MECHANISM, 2020-2026 (USD BILLION)
TABLE 57. ROE SPIROMETER MARKET VALUE, BY APPLICATION, 2020-2026 (USD BILLION)
TABLE 58. ROE SPIROMETER MARKET VALUE, BY END USER, 2020-2026 (USD BILLION)
TABLE 59. ASIA PACIFIC SPIROMETER MARKET VALUE, BY COUNTRY, 2020-2026 (USD BILLION)
TABLE 60. ASIA PACIFIC SPIROMETER MARKET VALUE, BY TYPE, 2020-2026 (USD BILLION)
TABLE 61. ASIA PACIFIC SPIROMETER MARKET VALUE, BY MECHANISM, 2020-2026 (USD BILLION)
TABLE 62. ASIA PACIFIC SPIROMETER MARKET VALUE, BY APPLICATION, 2020-2026 (USD BILLION)
TABLE 63. ASIA PACIFIC SPIROMETER MARKET VALUE, BY END USER, 2020-2026 (USD BILLION)
TABLE 64. CHINA SPIROMETER MARKET VALUE, BY TYPE, 2020-2026 (USD BILLION)
TABLE 65. CHINA SPIROMETER MARKET VALUE, BY MECHANISM, 2020-2026 (USD BILLION)
TABLE 66. CHINA SPIROMETER MARKET VALUE, BY APPLICATION, 2020-2026 (USD BILLION)
TABLE 67. CHINA SPIROMETER MARKET VALUE, BY END USER, 2020-2026 (USD BILLION)
TABLE 68. INDIA SPIROMETER MARKET VALUE, BY TYPE, 2020-2026 (USD BILLION)
TABLE 69. INDIA SPIROMETER MARKET VALUE, BY MECHANISM, 2020-2026 (USD BILLION)
TABLE 70. INDIA SPIROMETER MARKET VALUE, BY APPLICATION, 2020-2026 (USD BILLION)
TABLE 71. INDIA SPIROMETER MARKET VALUE, BY END USER, 2020-2026 (USD BILLION)
TABLE 72. JAPAN SPIROMETER MARKET VALUE, BY TYPE, 2020-2026 (USD BILLION)
TABLE 73. JAPAN SPIROMETER MARKET VALUE, BY MECHANISM, 2020-2026 (USD BILLION)
TABLE 74. JAPAN SPIROMETER MARKET VALUE, BY APPLICATION, 2020-2026 (USD BILLION)
TABLE 75. JAPAN SPIROMETER MARKET VALUE, BY END USER, 2020-2026 (USD BILLION)
TABLE 76. REST OF APAC SPIROMETER MARKET VALUE, BY TYPE, 2020-2026 (USD BILLION)
TABLE 77. REST OF APAC SPIROMETER MARKET VALUE, BY MECHANISM, 2020-2026 (USD BILLION)
TABLE 78. REST OF APAC SPIROMETER MARKET VALUE, BY APPLICATION, 2020-2026 (USD BILLION)
TABLE 79. REST OF APAC SPIROMETER MARKET VALUE, BY END USER, 2020-2026 (USD BILLION)
TABLE 80. REST OF WORLD SPIROMETER MARKET VALUE, BY TYPE, 2020-2026 (USD BILLION)
TABLE 81. REST OF WORLD SPIROMETER MARKET VALUE, BY MECHANISM, 2020-2026 (USD BILLION)
TABLE 82. REST OF WORLD SPIROMETER MARKET VALUE, BY APPLICATION, 2020-2026 (USD BILLION)
TABLE 83. REST OF WORLD SPIROMETER MARKET VALUE, BY END USER, 2020-2026 (USD BILLION)
TABLE 84. MIR, RECORDERS AND MEDICARE SYSTEMS: FINANCIALS
TABLE 85. MIR, RECORDERS AND MEDICARE SYSTEMS: PRODUCTS & SERVICES
TABLE 86. MIR, RECORDERS AND MEDICARE SYSTEMS: RECENT DEVELOPMENTS
TABLE 87. MGC DIAGNOSTICS CORPORATION: FINANCIALS
TABLE 88. MGC DIAGNOSTICS CORPORATION: PRODUCTS & SERVICES
TABLE 89. MGC DIAGNOSTICS CORPORATION: RECENT DEVELOPMENTS
TABLE 90. JONES MEDICAL INSTRUMENT COMPANY: FINANCIALS
TABLE 91. JONES MEDICAL INSTRUMENT COMPANY: PRODUCTS & SERVICES
TABLE 92. JONES MEDICAL INSTRUMENT COMPANY: RECENT DEVELOPMENTS
TABLE 93. HILL-ROM, INC: FINANCIALS
TABLE 94. HILL-ROM, INC: PRODUCTS & SERVICES
TABLE 95. HILL-ROM, INC: RECENT DEVELOPMENTS
TABLE 96. MIDMARK CORP: FINANCIALS
TABLE 97. MIDMARK CORP: PRODUCTS & SERVICES
TABLE 98. MIDMARK CORP: RECENT DEVELOPMENTS
TABLE 99. FUTUREMED: FINANCIALS
TABLE 100. FUTUREMED: PRODUCTS & SERVICES
TABLE 101. FUTUREMED: RECENT DEVELOPMENTS
TABLE 102. COSMED: FINANCIALS
TABLE 103. COSMED: PRODUCTS & SERVICES
TABLE 104. COSMED: RECENT DEVELOPMENTS
TABLE 105. MEDICAL INTERNATIONAL RESEARCH: FINANCIALS
TABLE 106. MEDICAL INTERNATIONAL RESEARCH: PRODUCTS & SERVICES
TABLE 107. MEDICAL INTERNATIONAL RESEARCH: RECENT DEVELOPMENTS
TABLE 108. VYAIRE MEDICAL: FINANCIALS
TABLE 109. VYAIRE MEDICAL: PRODUCTS & SERVICES
TABLE 110. VYAIRE MEDICAL: RECENT DEVELOPMENTS
TABLE 111. VITALOGRAPH: FINANCIALS
TABLE 112. VITALOGRAPH: PRODUCTS & SERVICES
TABLE 113. VITALOGRAPH: RECENT DEVELOPMENTS
TABLE 114. NDD MEDICAL TECHNOLOGIES, INC: PRODUCTS & SERVICES
TABLE 115. SCHILLER AG: PRODUCTS & SERVICES
Research Framework
Infoholic Research works on a holistic 360° approach in order to deliver high quality, validated and reliable information in our market reports. The Market estimation and forecasting involves following steps:
- Data Collation (Primary & Secondary)
- In-house Estimation (Based on proprietary data bases and Models)
- Market Triangulation
- Forecasting

Market related information is congregated from both primary and secondary sources.
Primary sources
Involved participants from all global stakeholders such as Solution providers, service providers, Industry associations, thought leaders etc. across levels such as CXOs, VPs and managers. Plus, our in-house industry experts having decades of industry experience contribute their consulting and advisory services.
Secondary sources
Include public sources such as regulatory frameworks, government IT spending, government demographic indicators, industry association statistics, and company publications along with paid sources such as Factiva, OneSource, Bloomberg among others.
![]()


